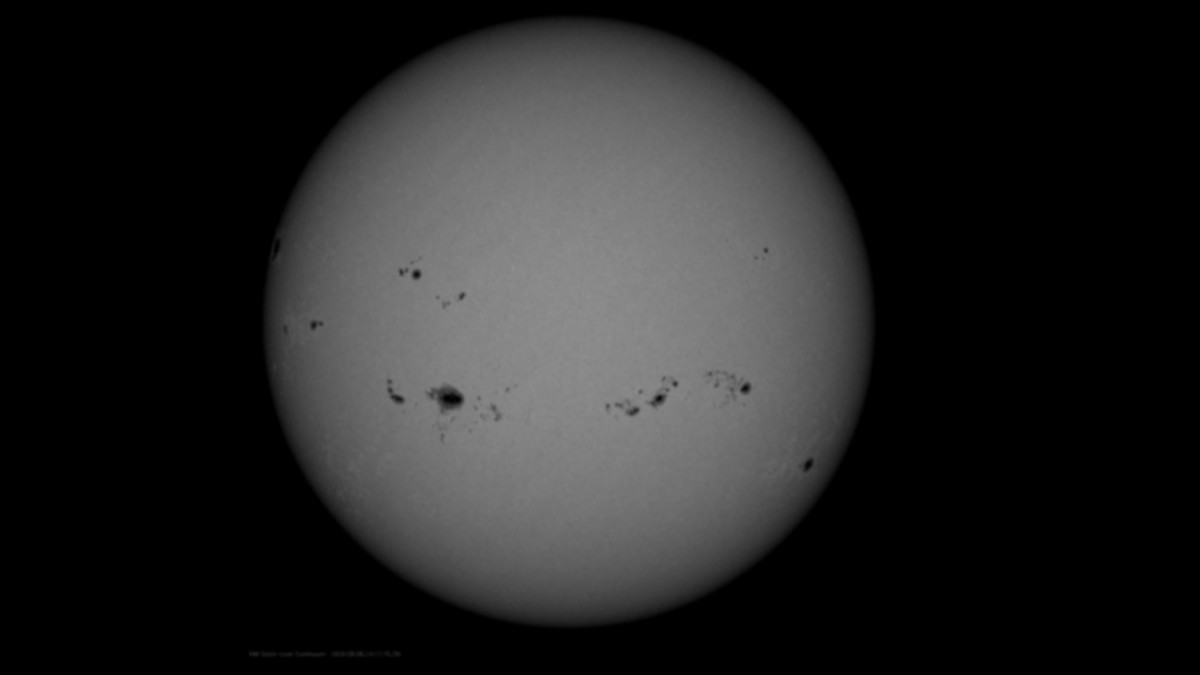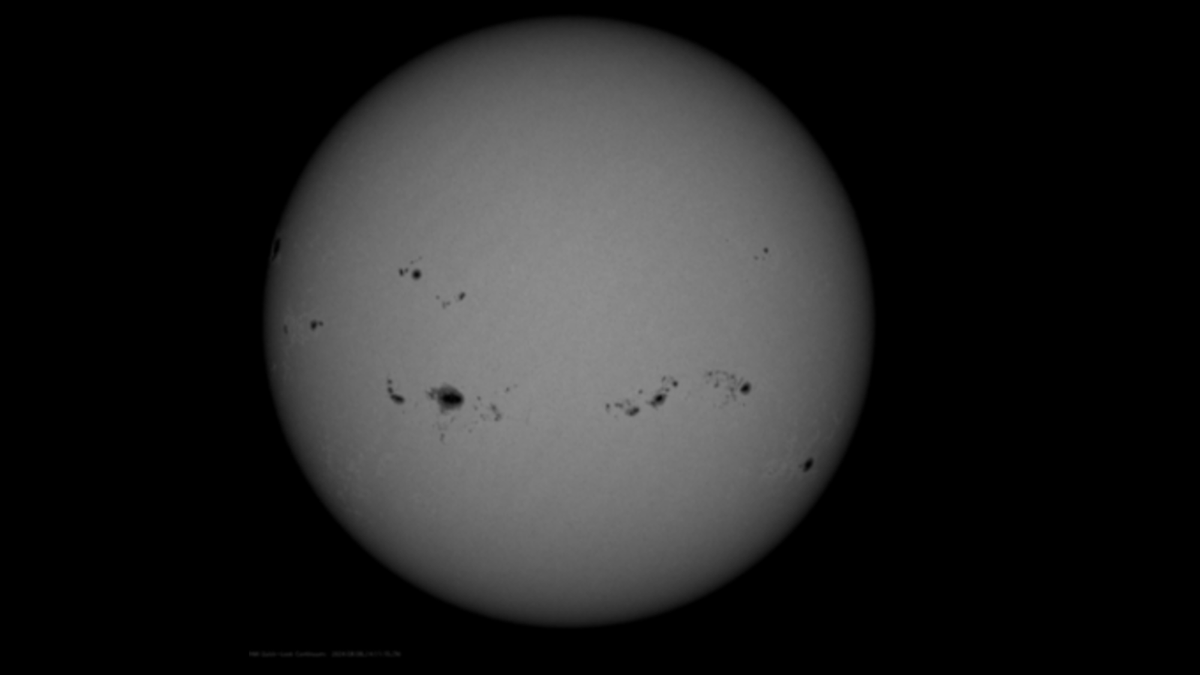
On Aug. 8, scientists may have caught hundreds of individual sunspots on images produced by NASA’s Solar Dynamics Observatory (SDO).
To us, sunspots might seem really tiny — but don’t be fooled. They are actually dark areas typically the size of the entire Earth on the sun’s surface. Plus, they exhibit strong magnetic fields that can fire off solar flares, which spew pulses of electromagnetic radiation into space. These are the explosions that lead to coronal mass ejections (CMEs) that can create solar storms on Earth.
“The process of the solar cycle, the 11-year (on average) dynamic of the sun that leads from solar minimum to maximum, and back to minimum, leads to localized areas of strong magnetic energy that develop on the sun. This is due to what is called differential rotation, where the solar equator is rotating much faster than the poles. When these areas are strong enough, they can lead to sunspot formation,” Shawn Dahl, the National Oceanic and Atmospheric Administration (NOAA)’s Space Weather Prediction Center (SWPC) Service Coordinator, told Space.com. “This Solar Cycle 25 is proving to be much more active than originally forecast by the scientist experts who predicted the cycle back in 2019 or so.”
Solar Cycle 25, which has already made a name for itself with intense geomagnetic storms that created show-stopping auroras around the world, most notably from atypical vantage points, could now also hold the spot for the biggest daily sunspot number (SSN) in more than 20 years. In a recent release, the SWPC reported that, using measurements from its resources, the value came in at 337, which would mark the first time scientists have seen a daily SSN that numerous since March of 2001.
“It is based on a standard calculation that we used based on United States Air Force (USAF) solar observatories that report sunspots to us at SWPC. But our sunspot number is not the official number; that comes later from Belgium and the Solar Influences Data Center (SIDC),” Dahl said. “Meanwhile, we analyze every group of spots visible on the sun and calculate their potential for solar flare and energetic particle events (R- and S-scale events), and we also produce a daily summary of all the active regions each day.
Although the SSN still is in the process of being finalized, which is expected to be released by the end of the month, the World Data Center – Sunspot Index and Long-Term Solar Observations (WDC-SILSO) and the Royal Observatory’s Solar Influences Data Center (SIDC) in Belgium currently approximate the count at 299, which would suggest the largest daily SSN since July 2002.
Related Stories:
As you may recall, Aug. 8 was also a very busy day for active sunspot regions. It was just the beginning of a period that lasted through Aug.10, during which solar flares fired off five CMEs toward Earth that led to the issuance of geomagnetic storm watches for our planet the weekend of Aug. 11 to Aug. 12.
“There was the R3 level flare that had an associated CME later on August 8 (AR 3774) that was associated with yet another CME. There had been a number of them during the week leading up to this one, but this CME appeared to have the higher level of confidence for an Earth-directed component and a G2 Watch was continued into that weekend accordingly,” Dahal said. “This was indeed suspected to be the CME that did arrive and eventually led to G1-G3 levels, and even a 3-hour period of G4 being reached.”


