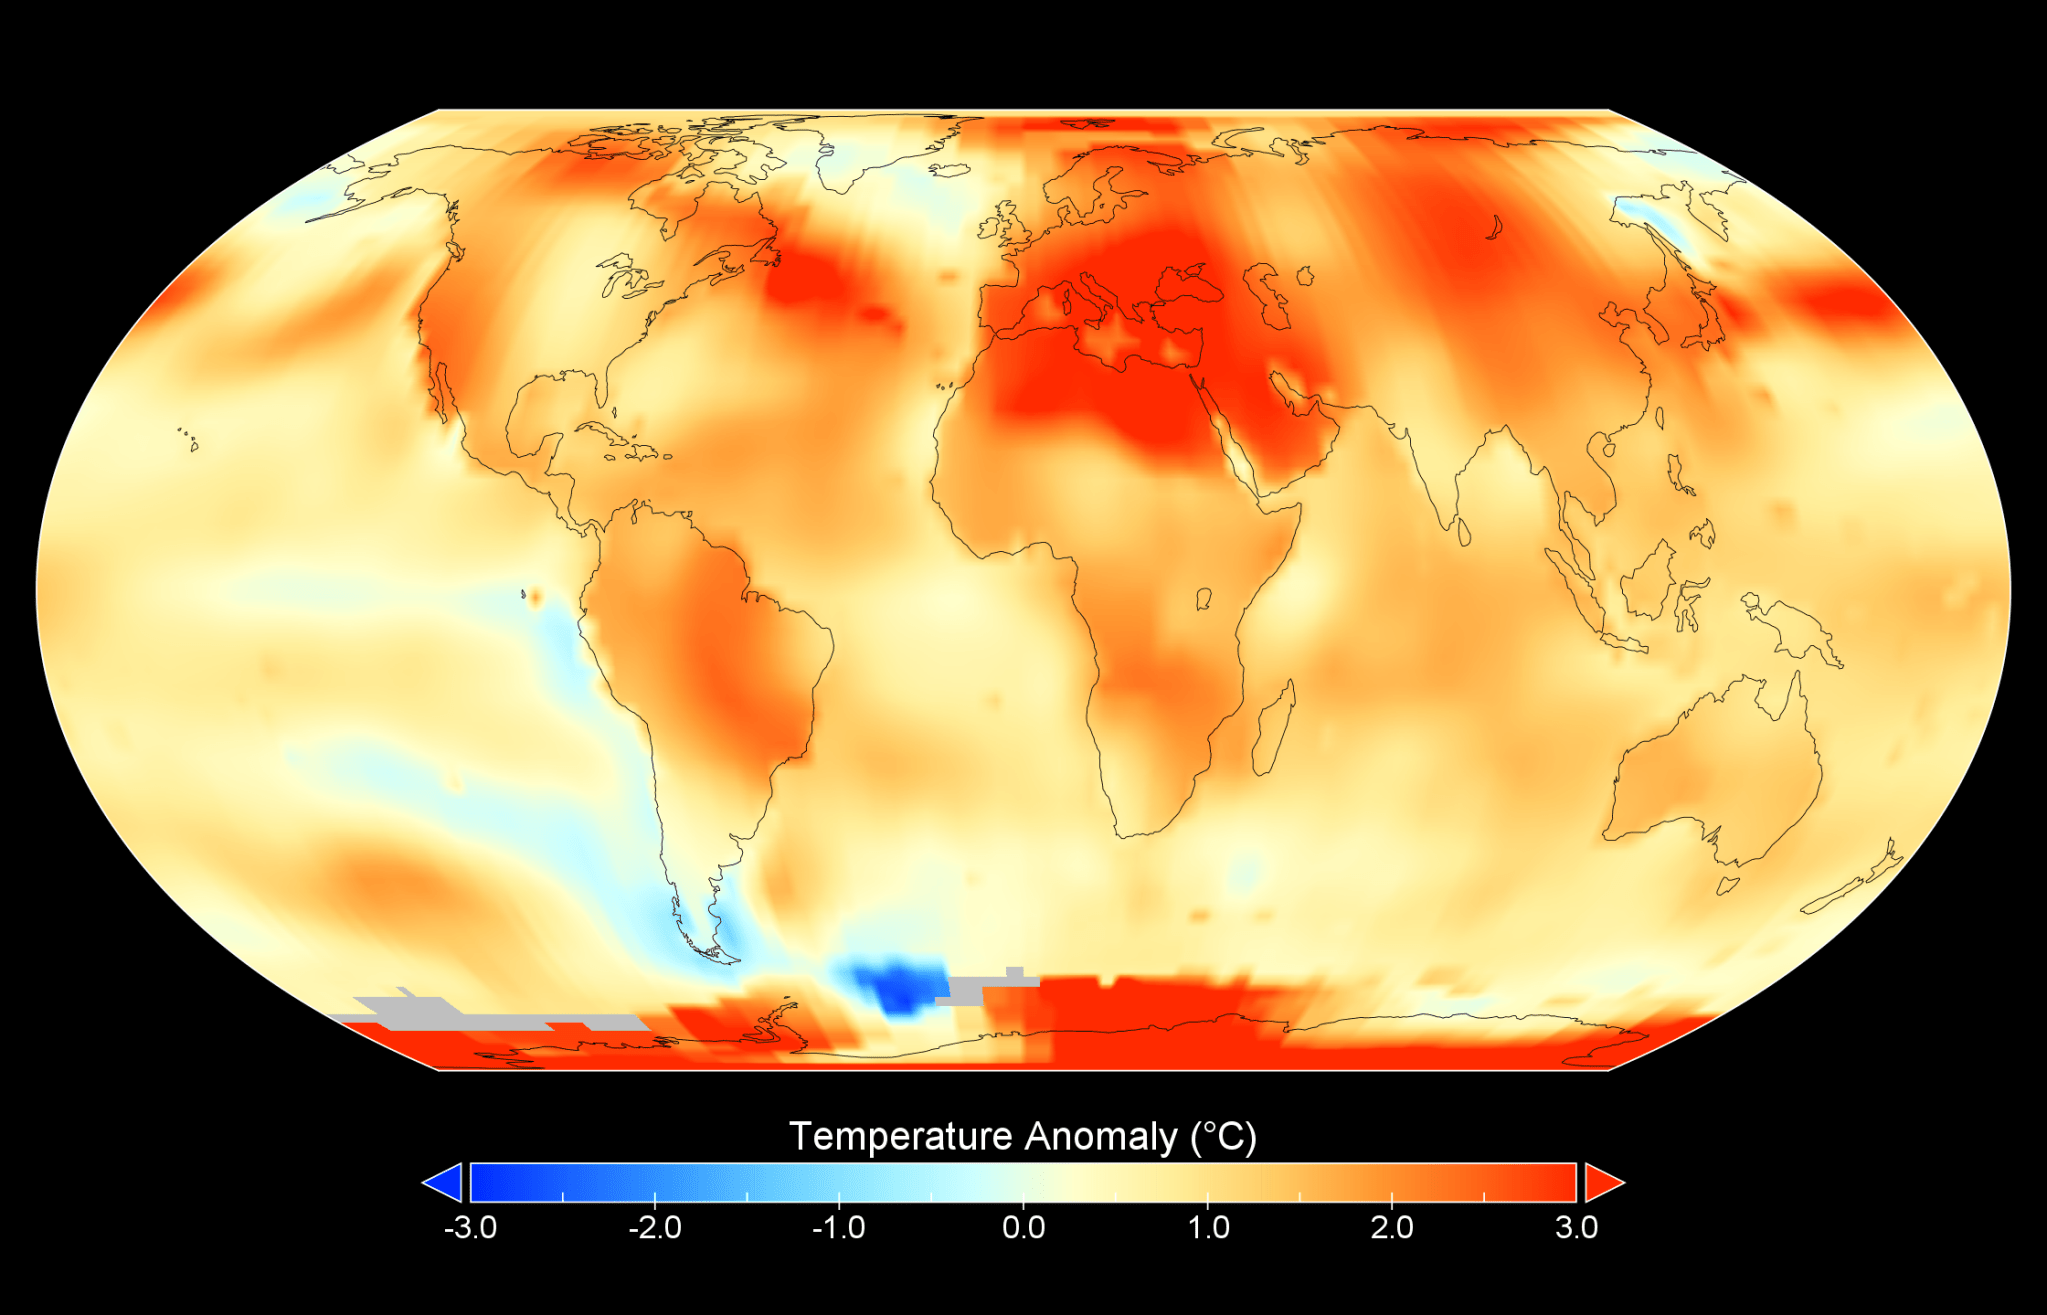
NASA’s PREFIRE mission is ready to unlock the mysteries of Earth’s poles

NASA is preparing to launch its latest climate science mission, the Polar Radiant Energy in the Far-Infrared Experiment (PREFIRE), which aims to capture brand new data on how heat is lost to space from Earth’s polar regions. PREFIRE consists of a pair of cubesats that will launch separately into near-polar orbits. The first, “Ready, Aim, PREFIRE,” is set to launch no earlier than (NET) May 22, on a Rocket Lab Electron rocket from Pad B at the company’s Launch Complex 1, in Māhia, New Zealand. The second cubesat, “PREFIRE and…

Read More

Meet NASA Women Behind World’s Largest Flying Laboratory

5 min read Preparations for Next Moonwalk Simulations Underway (and Underwater) NASA’s DC-8 aircraft – the world’s largest flying science laboratory – began its science missions in 1987 and since then, has flown in service of the science community over places like Antarctica, Greenland, and Thailand. Aircraft like the DC-8 have enabled scientists to ask questions about life on Earth and explore them in a way that only NASA’s Airborne Science program can make happen. After 37 years, the DC-8 will retire to Idaho State University, where it will serve…

Read More

International SWOT Mission Can Improve Flood Prediction 

6 Min Read International SWOT Mission Can Improve Flood Prediction  Flooding on the Souris River inundated this community in North Dakota in 2011. The U.S.-French SWOT satellite is giving scientists and water managers a new tool to look at floods in 3D, information that can improve predictions of where and how often flooding will occur. A partnership between NASA and the French space agency, the satellite is poised to help improve forecasts of where and when flooding will occur in Earth’s rivers, lakes, and reservoirs. Rivers, lakes, and reservoirs are…

Read More

Beavers are helping fight climate change, satellite data shows

As global warming intensifies droughts, floods and wildfires around the world, scientists in western United States are turning to beavers to help reverse some of the damage. Scientists at Utah’s Boise State University and Utah State University are using satellite data to identify streams where once-eradicated beavers can be re-introduced to boost vegetation. They’re also recording how water abundance and vegetation bordering those streams changes once beavers return — metrics of environmental health. “The real value of using satellite data for monitoring is that there are people on the ground…

Read More

NASA Data Helps Beavers Build Back Streams

2 min read Preparations for Next Moonwalk Simulations Underway (and Underwater) A beaver family nibbles on aspen branches just up Logan Canyon from Utah State University, in Spawn Creek, Utah. Credit: Sarah Koenigsberg Humans aren’t the only mammals working to mitigate the effects of climate change in the Western United States. People there are also enlisting the aid of nature’s most prolific engineers – beavers. Using NASA-provided grants, two open-source programs from Boise State University in Idaho and Utah State University in Logan are making it possible for ranchers, land…

Read More

NASA Selects New Aircraft-Driven Studies of Earth and Climate Change

Earth (ESD) Earth and Climate Explore Climate Change Science in Action Multimedia Data More For Researchers 5 min read NASA Selects New Aircraft-Driven Studies of Earth and Climate Change NASA has selected six new airborne missions that include domestic and international studies of fire-induced clouds, Arctic coastal change, air quality, landslide hazards, shrinking glaciers, and emissions from agricultural lands. NASA’s suite of airborne missions complement what scientists can see from orbit, measure from the ground, and simulate in computer models.   Funded through the agency’s Earth Venture program, the missions…

Read More

Climate Change Research

6 Min Read Climate Change Research The Kibo laboratory module from the Japan Aerospace Exploration Agency (comprised of a pressurized module and exposed facility, a logistics module, a remote manipulator system and an inter-orbit communication system unit) pictured as the International Space Station orbits over the southern Pacific Ocean east of New Zealand. Credits: NASA Science in Space: April 2024 Everyone on Earth is touched by the effects of climate change, such as hotter temperatures, shifts in rain patterns, and sea level rise. Collecting climate data helps communities better plan…

Read More

Studying Arctic Ice

NASA/Kathryn Hansen In this image from July 12, 2011, crew from the U.S. Coast Guard Cutter Healy retrieve a supply canister dropped by parachute during the Impacts of Climate on Ecosystems and Chemistry of the Arctic Pacific Environment, or ICESCAPE, mission. ICESCAPE was a multi-year project sponsored by NASA to determine the impact of climate change upon the health of the Arctic Ocean. The bulk of the research took place in the Beaufort and Chukchi seas in summer 2010 and 2011. See more photos from this mission. Image Credit: NASA/Kathryn…

Read More

El análisis de la NASA confirma que 2023 fue el año más cálido registrado

Este mapa de la Tierra en 2023 muestra las anomalías de la temperatura global de la superficie, es decir, cuánto más cálida o más fría estuvo cada región del planeta en comparación con el promedio del período de 1951 a 1980. Las temperaturas normales se muestran en blanco, las superiores a las normales en rojo y naranja, y las inferiores a las normales en azul. Una versión animada de este mapa muestra la evolución de las anomalías de la temperatura global a lo largo del tiempo, desde 1880. Descarga esta…

Read More

NASA Analysis Confirms 2023 as Warmest Year on Record

This map of Earth in 2023 shows global surface temperature anomalies, or how much warmer or cooler each region of the planet was compared to the average from 1951 to 1980. Normal temperatures are shown in white, higher-than-normal temperatures in red and orange, and lower-than-normal temperatures in blue. An animated version of this map shows global temperature anomalies changing over time, dating back to 1880. Download this visualization from NASA Goddard’s Scientific Visualization Studio: https://svsdev.gsfc.nasa.gov/5207. NASA’s Scientific Visualization Studio Lee esta nota de prensa en español aquí. Earth’s average surface temperature…

Read More